State of the Union App
Last year, I took Coursera’s “Developing Data Products” in the Data Science sequence, mostly because I wanted more practice in creating Shiny apps. For the final project, I made an app that tracks use of different words in yearly State of the Union addresses. Check it out here.
The app is relatively basic; I limit users to looking at a set of 31 different words that I found interesting. I may add in more features at some point – probably the next time I want more Shiny practice!
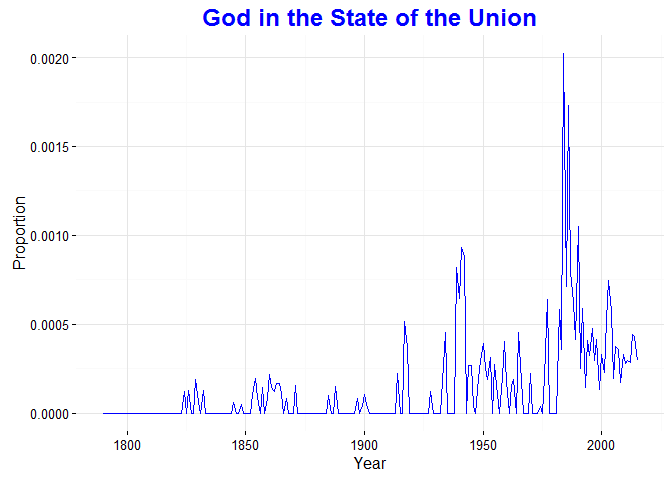
One of my favorite graphs is the one for “God”. We are so used to politicians ending speeches with “God bless the United States of America,” but it is a relatively new phenomenon (Also see James Fallows on this). And it wasn’t until the 1940s and 50s that God became a frequent part of SOTU addresses.

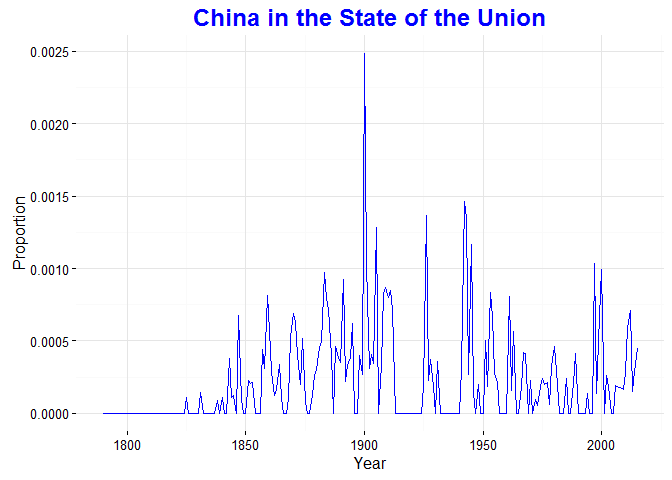
The next graph – looking at mentions of China[1] in the SOTU – is more relevant to my dissertation research. Not surprisingly, mentions of China have been up and down over time. Since 1950, the address with the most mentions of China was President Carter’s speech in 1980, following normalization of relations with mainland China. However, the speech with the largest focus on China occurred in 1900 when William McKinley used much of the first part of his speech to discuss the Boxer Rebellion.

Here I have a larger github repository with all of the speeches and the code for organzing the data. The one thing that isn’t reflected in the code is that the python script does not deal with years where the president gave both a written and spoken address. I copied those manually (yes, I know this is not good practice.)
[1] This graph is slightly different than the one in the app because I did not include word boundaries in the regex searches – something else that needs to be updated. In particular, you see one case of China being mentioned in 1794, which actually comes from the word “machinations”.
© 2025 Jen Haskell ― Textlog theme by Heiswayi Nrird